In the fall, my co-resident introduced my mentor and me to an online software called EGSI. With this software, teachers and/or educators can administer tests to students using the iPads. Teachers can develop and add their own tests to the software. All the information remains stored in the program and you do not have to worry about misplacing it. One of the tests we created and administered was a sight words test.
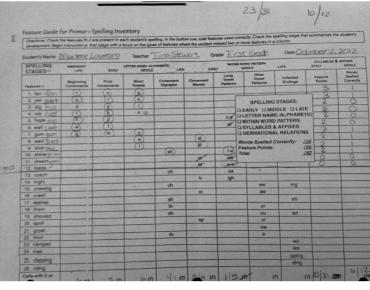
Before being introduced to the program, I was used to testing students using notebook paper or a spelling inventory sheet similar to the one shown below. Once organized, we tested the students one-by-one. Once finished, the program allowed us to print out a parent letter informing parents which words their students did not know. From here, we could also print out flash cards for the students to take home and practice.
I feel that the EGSI program is very effective and it saves time as well as trees. Next year, as a CPS teacher of record, I will use EGSI as a way to assess my students knowledge with not onl sight words but math and reading. If I am unable to persuade my principal to purchase the software, I plan on collaborating with the primary teachers or purchasing the program for my own use.
 |  |
For my May turnaround visit, I requested to return to my students at Harvard. Prior to the turnaround visit, my coresident and I had been working diligently with the students on coins, clocks, fact triangles, and addition and subtraction. At this point in the program, I realized I had not had the chance to design and deliver a math assessment or test. In order to test my skills and examine how much my students knew, I gave them the test below. Based on the scores that the students received, I am confident that they will not have trouble with these concepts in second grade.
Below is a coin exit ticket that I gave my students in the Winter. Following a coins math lesson, they were expected to count up the amount shown and record it on the line. Next to the exit ticket is a picture of my first data graph. It shows, in blue, how many students got both of the questions correct. In yellow, the graph shows how many students got one of the questions correct. The red, on the graph, indicates the students who missed both questions.
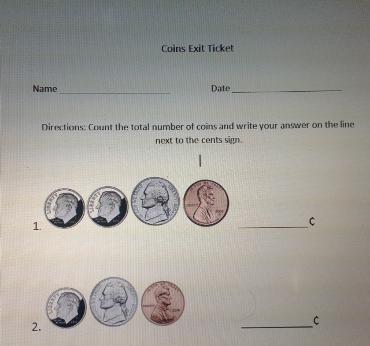 | 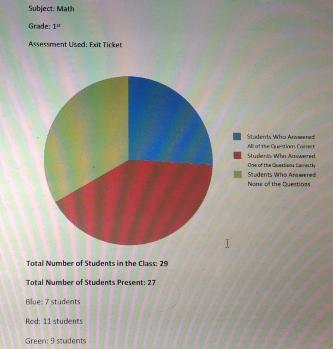 |
Graph and exit ticket made by Michelle Wade
Below is the breakdown of a math assessment given to my students at Tarkinton. In the graphs below, made by my co-resident, Sarah O' Connor, each student is listed, what they were tested on, how many points each section was worth, and how many points they received. On the right of that graph, Excel tallies up the points and gives an averages. The colorful graph lines each student up and shows where each student had a problem. Every section is colorcoded. The graph below it lists each section of the test and tells how many students answered all the questions correctly.
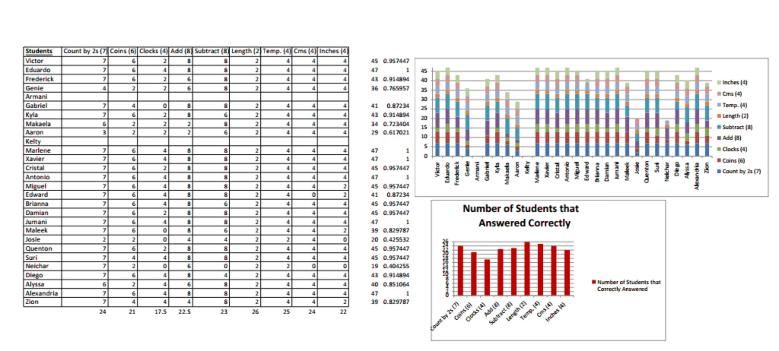
*Graphs made by Sarah O' Connor
Below is a graph that highlights the results of a math test I administered to my students at Harvard School of Excellence. Down the left side of the chart are the students' names. In the middle of the graph are the scores for each section of the math test. The scores highlighted in green represent students that got all of those questions correct. Scores highlighted in yellow represent students that missed one question. Scores highlighted in blue represent students that missed more that two of the questions or did not get an of the questions correct.
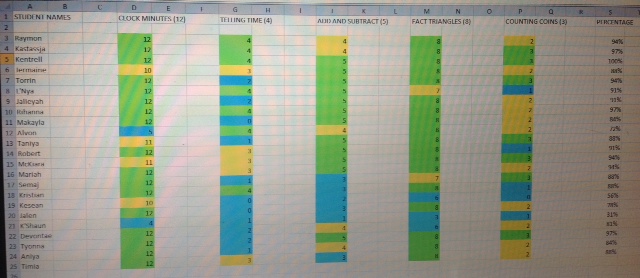
*Graph by Michelle Wade
Based on the information and the color coding, I noticed that the students had a better handle on identifing clock minutes (counting by 5s) and fact triangles than telling time, addition and subtraction, and counting coins.
HOW DOES THIS INFORM MY INSTRUCTION /NEXT STEPS
 Organize two sets of small group activities or centers.
| 
|
In the future, while working with students, I will also take the time to examine my instructional methods. If I find that a large portion of my students are having difficulty with a certain topic, I will return to lesson plans, adjust them, reteach the lesson, and monitor the progress of my students. I also plan on experimenting with Excel in order to organize my students based on the graphs above. With doing my data in Excel or a similar program, I feel like I will be able to look across the graphs, quickly notice what areas my students are struggling in, group them according to ability and/or help, design centers and math games that will meet their needs, and demonstrate data usage with my future administration.